I have been looking at the stock markets ever since I was a little boy, and have become actively involved in it at the age of 26. Since then I have struggled to achieve the holy grail of truly understanding the markets. Until one day I realized this wasn’t necessary to have an idea of how the future looks like. Although that certainly would help, but it is very, very difficult.
Saved by Harry
In 2012 I came across an article about Harry Browne, who invented something called the permanent portfolio. I still kick myself for not noticing this earlier. What Browne said was something along the lines of “forget forecasting, you can’t know for sure what will happen anyway. Instead try to compose a portfolio that makes money in both a growing and contracting economy, and in an environment that is inflationary or deflationary”. He came up with something that involved holding silver, the swiss franc, US stocks, a mix of bonds and a lot more.
Though this portfolio did very well at that time, Browne realized it was too complex and he also felt he cheated a bit because the portfolio would do much better in an inflationary environment which was the situation at that time and would continue for a couple of years. He wanted to get this element of luck out of the equation and finally he arrived at something extremely simple.
Funny thing is, he first proposed this portfolio in the 1980’s. When I read about the first time it was 2012 and the results completely blew me away. It’s not that the portfolio, which incidentally he called “the permanent portfolio” delivered such a high return, but the variation of those returns was so small. What do I mean by that? Well, if you look at a graph that shows the development of a permanent portfolio, it is almost like straight line:
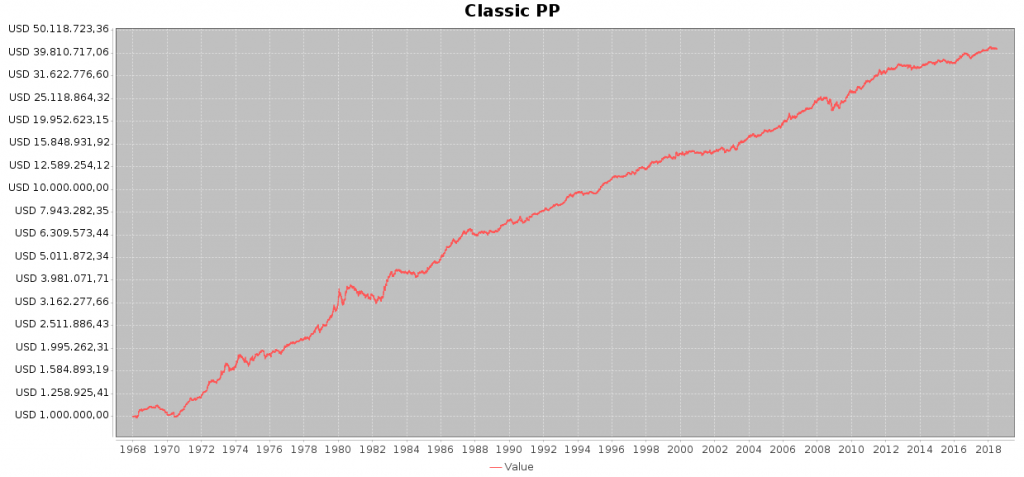
That looks amazing, doesn’t it? The crash of 1987, the internet bubble, the aftermath of Lehman Brothers collapsing… they are just blibs on the chart. More importantly, this is a reliable result: Browne presented this in the eighties, which means we have something like 30 years of out-of-sample data. On top of that, there is not much trading going on in all these years. So the results are not influenced by transaction costs, slippage etc. That’s why it’s called the permanent portfolio: it stays roughly the same year after year.
By now I hope you’re interested. If not, let me convince you with some numbers:
- The average compounded rate of return is about 7% after inflation.
- The Sharpe ratio is about 0.35
- The largest drawdown (peak-to-valley drop) is 18%. Compare that to investors that held only stocks and lost 57% in 2008, or 22% in just one very nasty day in 1987.
- No matter how bad your timing is for starting the portfolio, within 5 years you will be ahead for good. Compare that to unlucky investors who got into stocks just before the internet bubble popped. They had to wait 8 years before they finally broke even. Unfortunately, they then immediately lost 57% in 2008. All in all they had to wait 13 years to finally get ahead. And it is still possible that one day they will be again below their initial value.
If you are still not impressed, plot a graph of the development of you own portfolio. Be honest. Did you beat these results? Then chances are you starting investing after 2009. No you are not a guru, you just had never had tough market circumstances. For all others, I think that if you are really honest you will be at least intrigued by how this works. You have weathered the LTCM crisis, the dot com bubble and the collapse of Lehman and dread one of those events will happen again. It’s no fun having to go through losses of more than 30%. Most people will throw in the towel, only to get back on board when the market is at a new peak again. We’re all humans, nothing to be ashamed of. If you want the thrill of the ride, go ahead and put everything in stocks. Want to make money? Then go for the permanent portfolio.
How to do it
split your money into four equal pieces and invest in the following:
- 25% Stocks
- 25% Long term bonds
- 25% Gold
- 25% Cash
In the early days of the permanent portfolio this was pretty hard to realize, unless you had a sizable account. Nowadays, with ETFs available for almost everything this is within the reach of small investors as well. The following list shows some low cost ETFs that allow you to implement the components of the portfolio. If you have a somewhat bigger account it can be beneficial to use futures to cover the larger portions of you portfolio. I’ve put the futures in brackets.
- Stocks: VTI (ES)
- Long term bonds: TLT (ZB)
- Gold: GLD (GC)
Note that this portfolio is nominated entirely in US dollars. If you don’t live in the US, you should ideally hedge the currency risk. For instance if you live in the Netherlands, as I do, you should buy EUR/USD futures with a nominal value of the value of the portfolio. If you have a relatively small account but you live in a country with a stable currency you can forget about this. If your currency is not that stable it usually means you have high inflation in which case you will benefit from the strong US dollar, but that is a gamble. Another way is to find ETFs in your own currency.
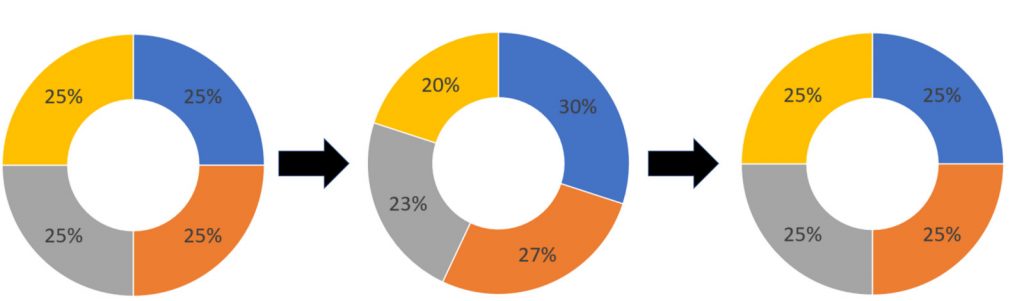
Rebalancing
Is that it? Just buy those three assets and keep the rest of your money in cash? Yes. Well, almost. Every once in a while the composition of your portfolio will be a bit out of whack. For instance if stocks had a great run, and gold dropped in value it could very well be that stocks now represent 30% of your portfolio, and gold less than 20%. Whenever one of these asset classes goes above 30% or below 20% it is time to rebalance. In other words, sell some of the high priced assets and buy more of the lower valued assets in such a way that after those transactions you end up with a portfolio that has all four components in equal value.